Visualizing Code: A Guide to Creating Diagrams from Your Logic
Introduction:-
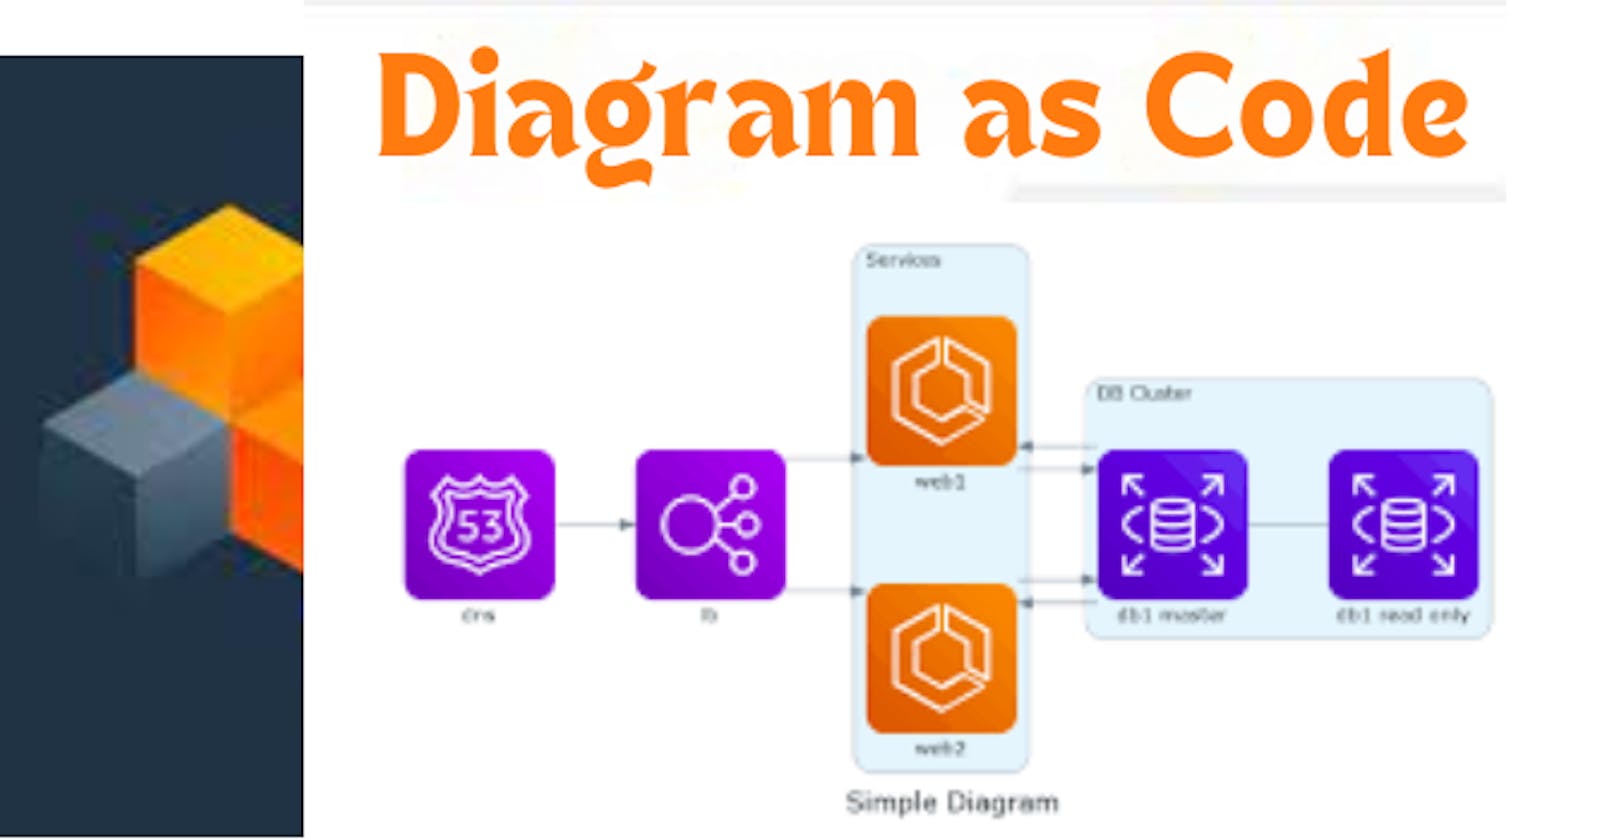
Have you ever wished for a magic wand to turn your intricate code into a visual masterpiece? The good news is, you don’t need a wand; you need a diagram! This guide will walk you through the art of creating diagrams from code, unraveling the power of visualization for better understanding, collaboration, and documentation.
Pre-requestites :-
- Python&Python3 Should be installed on your local machine.
Steps to create Diagram using code --
Step-1 :- Create a folder with your required name and within the folder create a file with name diagram.py
Step-2 :- Now we need to write a python code to create an image using the code. Click here and follow the document to write a code to create a diagram.
Step-3 :- Write a code within the diagram.py file and open a terminal window and locate to the folder.
#EXAMPLE CODE

from diagrams import Cluster, Diagram
from diagrams.aws.compute import ECS, EKS, Lambda
from diagrams.aws.database import Redshift
from diagrams.aws.integration import SQS
from diagrams.aws.storage import S3

with Diagram("Mahira Technology Simple Architecture", show=False):
    source = EKS("k8s source")

    with Cluster("Event Flows"):
        with Cluster("Event Workers"):
            workers = [ECS("worker1"),                       ECS("worker2"),                       ECS("worker3")]

        queue = SQS("event queue")

        with Cluster("Processing"):
            handlers = [Lambda("proc1"),                        Lambda("proc2"),                        Lambda("proc3")]

    store = S3("events store")
    dw = Redshift("analytics")

    source >> workers >> queue >> handlers
    handlers >> store
    handlers >> dw
Step-4 :- After locating to the folder run the below command to create a diagram using the code.
python3 diagram.py
Step-5 :- Once the above command is being executed a diagram will be created in the same folder.
Step-6 :- Open the diagram using a image viewer and it might looks like below.

Conclusion :-
As we wrap up this journey into the realm of code visualization, remember that a picture is worth a thousand words, especially in the language of programming. Whether you’re a seasoned developer or just starting, incorporating diagrams into your workflow can enhance communication, foster collaboration, and make your codebase more accessible to all. So, why not turn those lines of code into a visual masterpiece?
